
When you launch a model follow-up with VXtrack, it can be tedious to really see how our models evolve. The chart can be unreadable, especially when you try to position a model against another. What we really want is simple: just to find out the relationship between 2 models in the last seconds of this movement.
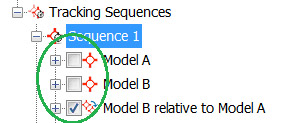
The first thing to do is to uncheck all the models you don’t need to see onscreen. This will expand the window for the relationships that are of interest to us.
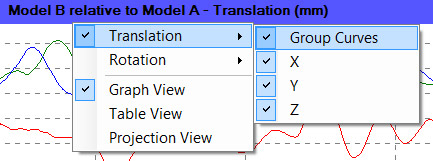
In order to improve the readability of the curves, it is also very convenient to be able to separate the axes on different charts, by right-clicking on the chart, then choosing whether or not to group the curves together. It is additionally possible to display a single axis, but also to show rotation!
We’ve already come a long way! Here are 2 different ways of only seeing the last few seconds:
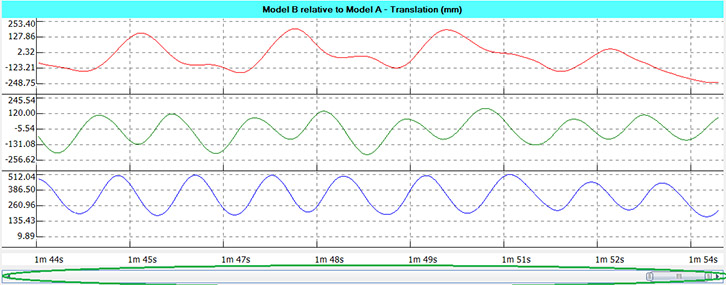
- If you only want to see the last few seconds, but also record all the positions since the initial time, you can use the chart bottom cursor and set it to only see the last few seconds, the ones we’re interested in.
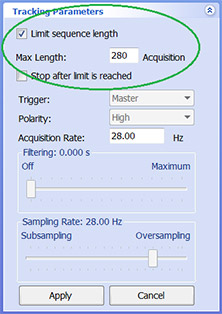
- If you only want to see the last few seconds, and only record the model position during these last few seconds, you need to check the Limit Sequence Length box under Tracking Parameters. This tool enables you to limit the information and thus make processing easier!
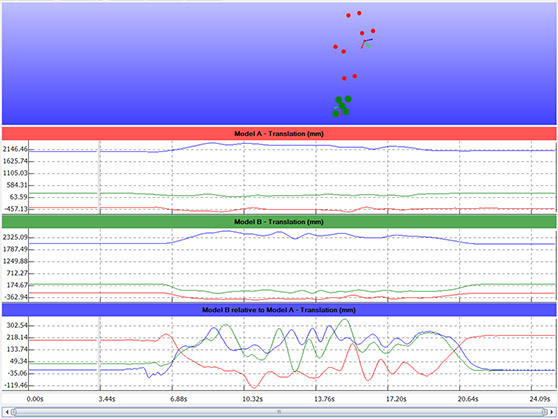
Before (you can see all the models, all the superimposed curves…)
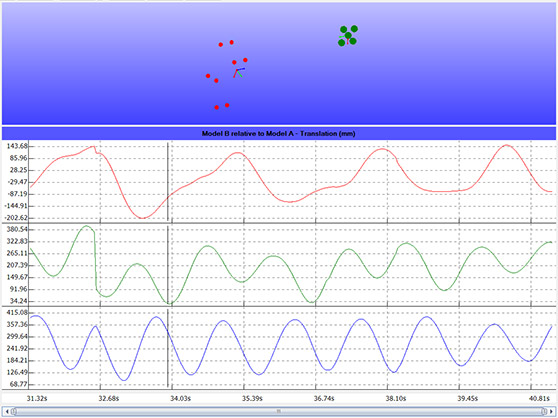
After (only the last 10 seconds of the model relationship are shown)
The automatic scaling can shorten processing time, increase visibility on the curves and obtain a much better reading precision!